


![Trends in Online Business Acquisitions [2024 Edition]](https://d1x7qj5rlh2e19.cloudfront.net/wp-content/uploads/2024/04/01145357/Business_acquisition-2021639264.jpg)
A combination of factors, including interest rate hikes, inflation, and geopolitical instability, contributed to a deceleration in M&A activity during the latter half of 2022 and initial months of 2023. However, as concerns over a possible recession have subsided and as the Federal Reserve has hinted at lower rates in 2024, the M&A landscape is experiencing a notable comeback. Recent months have seen significant increases in both deal volume and sale prices, indicating stronger market activity.
These shifts in the economic landscape, coupled with pent-up demand following a period of diminished deal volume spanning more than a year, have spurred optimistic forecasts from industry leaders such as PwC and Bain, predicting a robust year ahead for deal-making.
In anticipation of heightened activity, researchers at Flippa—the world’s leading platform to buy and sell online businesses—analyzed key deal characteristics of more than a thousand business sales over the past two years. This extensive dataset encompasses nine primary business types, 15 sectors, and nearly 60 subsectors, providing valuable insights to assist potential buyers and sellers in navigating the evolving landscape of M&A.
Profit Multiples by Deal Size
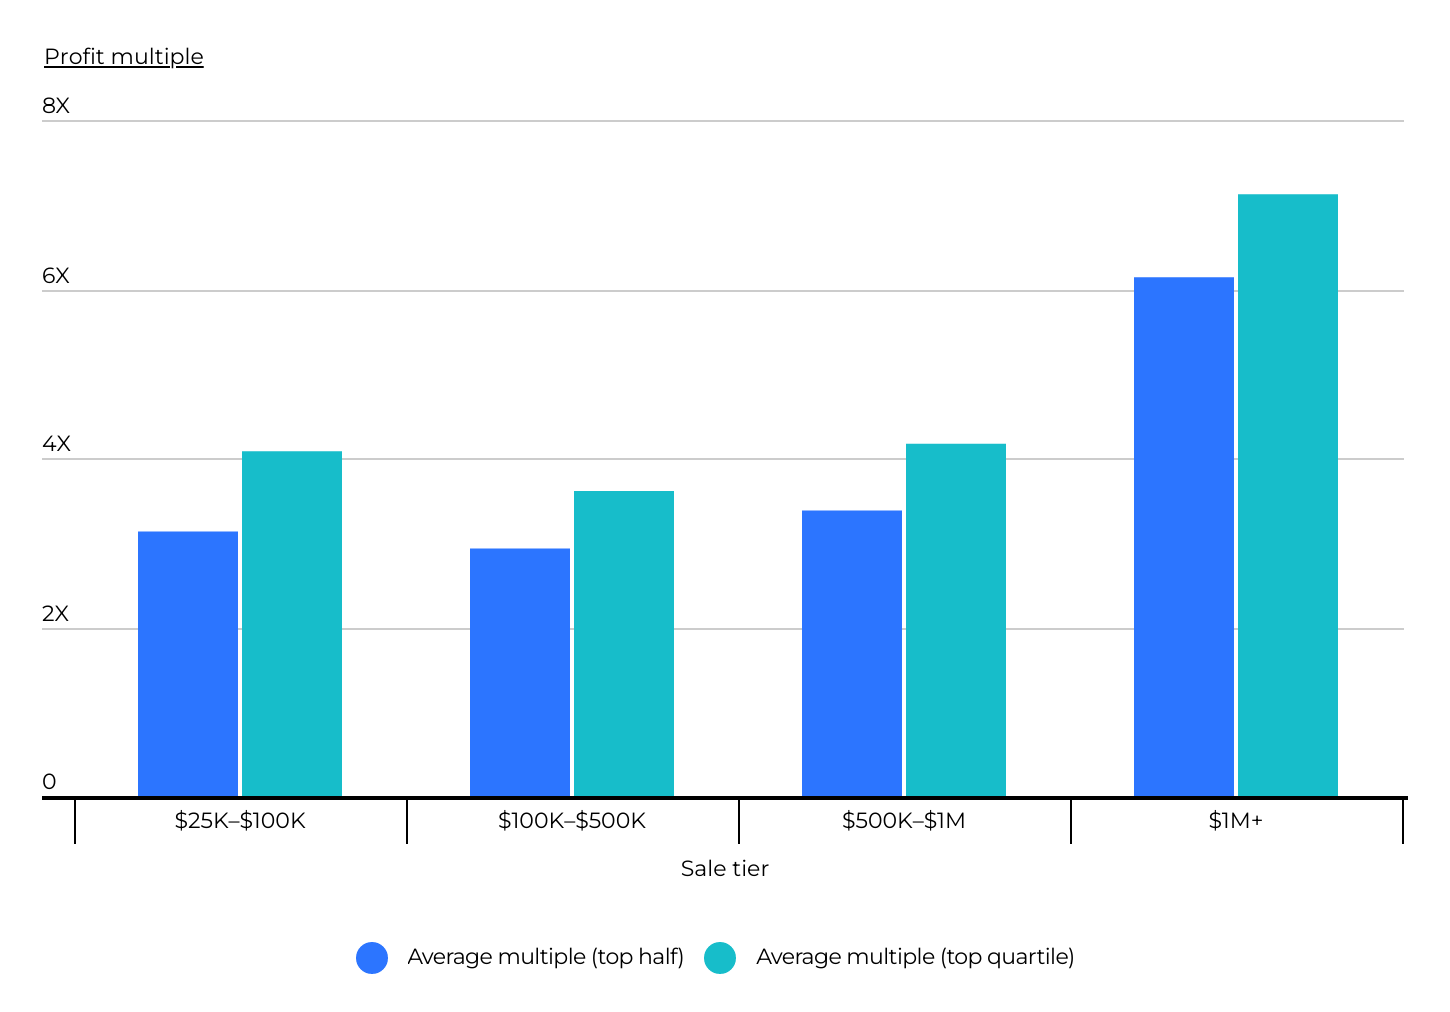
Source: Flippa marketplace transactions
Profit multiples vary depending on the dollar value of the acquisition, with a clear trend of increasing multiples as the deal size grows. For micro businesses exiting from $25,000 to $100,000, profit multiples averaged 3.1, with the top quartile reaching 4.1. However, for businesses exiting in excess of $1 million, the trend accelerates with profit multiples rising to an average of 6.1, and the top quartile reaching an impressive 7.1.
The observed trend of increasing profit multiples with larger deal sizes can be attributed to several factors. Larger acquisitions often entail businesses with established revenue streams, stronger market positions, and greater growth potential. Consequently, buyers may be willing to pay higher multiples for businesses with a proven track record of performance and scalability. Additionally, larger acquisitions may offer strategic alignment or operational efficiencies that justify higher valuations. Moreover, larger deals may attract a more competitive bidding process, driving up valuations and resulting in higher profit multiples for sellers.
Company Financials by Deal Size
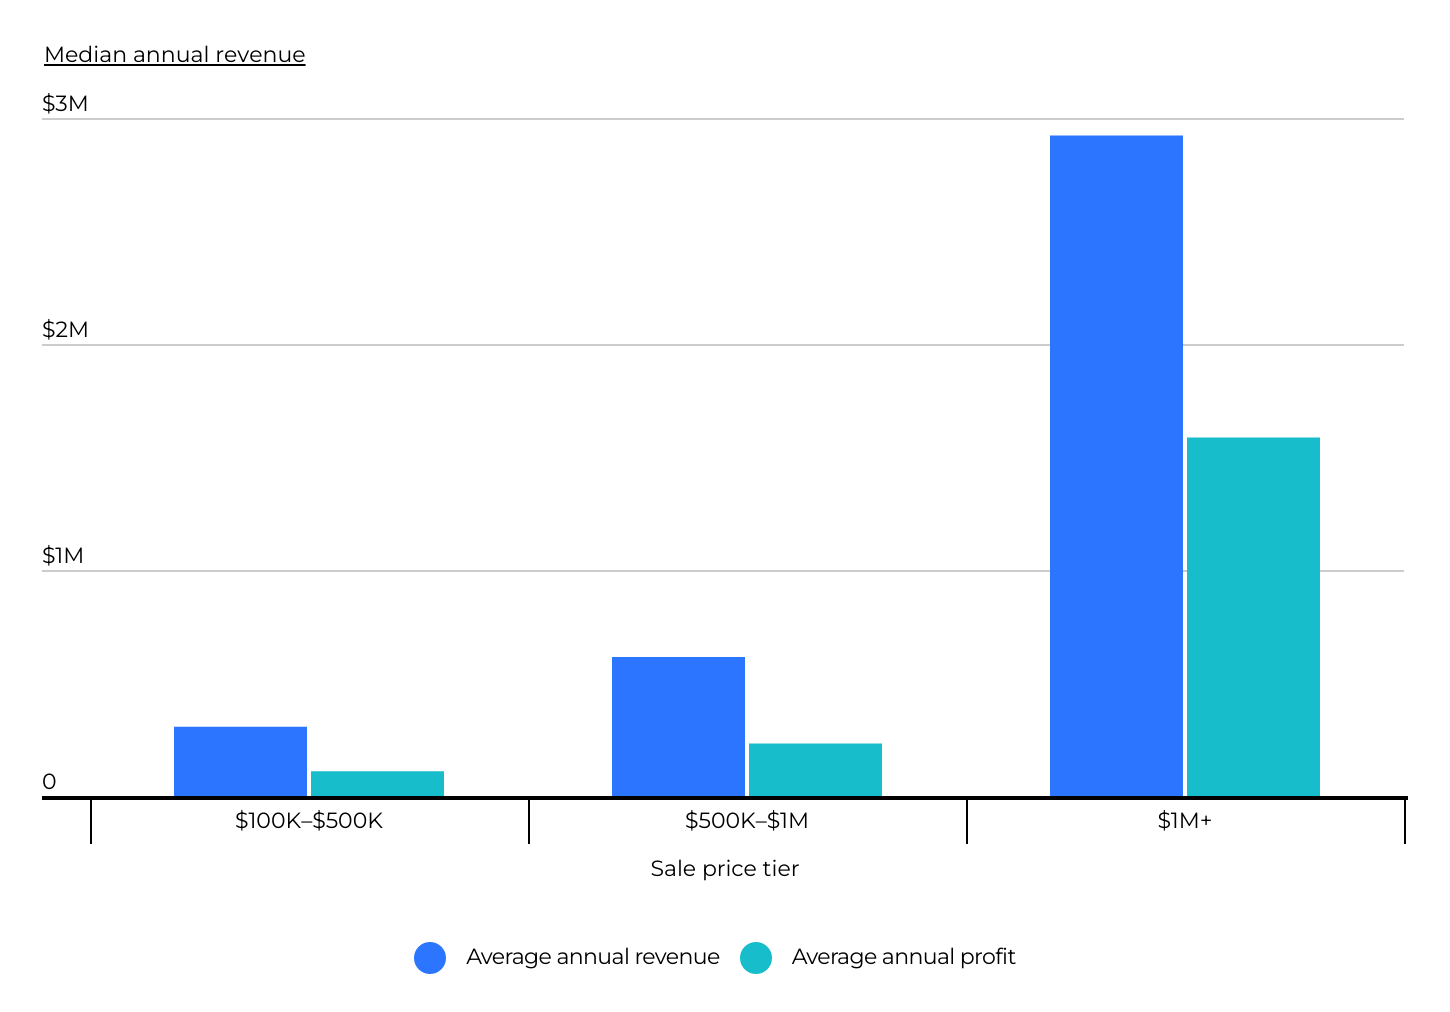
Source: Flippa marketplace transactions
A common question among sellers revolves around what it takes to achieve a seven-figure exit. Analyzing Flippa data spanning the past two years shows that businesses that sold for at least $1 million had an average annual revenue of $2.8 million, with an average annual profit of approximately $1.6 million. Interestingly, there was no statistically significant difference in the average age of businesses across the sales tiers, with the typical business age at the time of sale falling between nine and 10 years. It was surprising to see how established and tenured these businesses are.
Days on Market by Deal Size
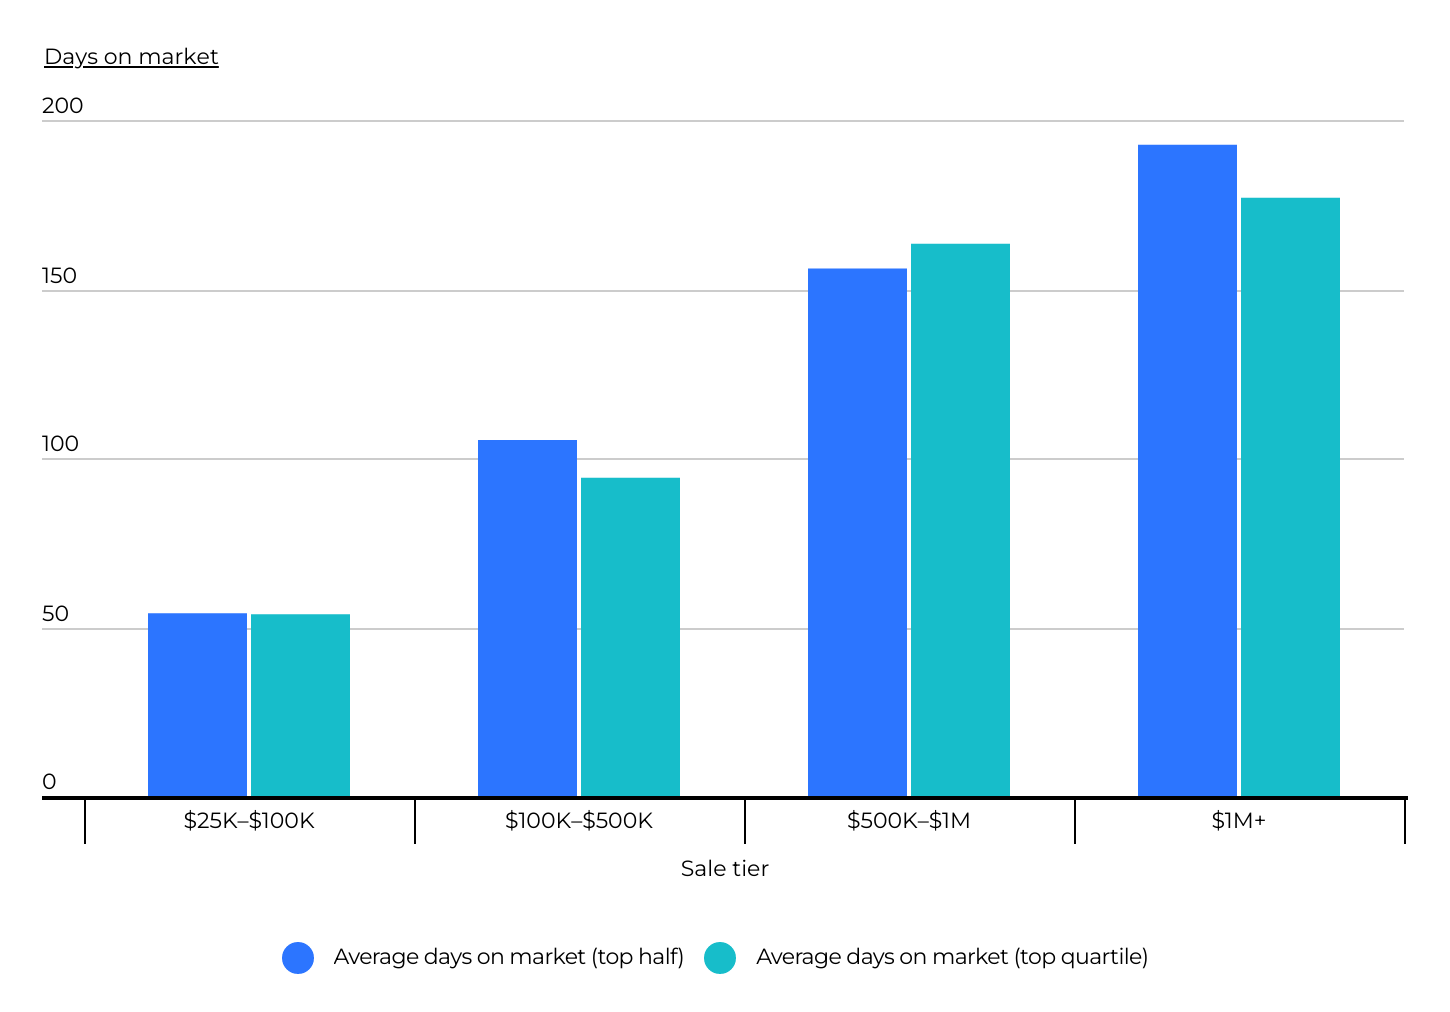
Source: Flippa marketplace transactions
Another noteworthy difference between the sales price tiers pertains to the time it takes to complete a sale. Businesses that achieved seven-figure exits typically remained on the market for nearly twice as long as those that sold for $100,000 to $500,000 (193 days compared to 105 days). Despite the prolonged waiting period for higher-price-tier sellers, they generally secured more favorable profit multiples than their lower-price-tier counterparts. As discussed previously, the average profit multiple for seven-figure exits over the past two years was 6.1, compared to 2.9 for businesses in the $100,000 to $500,000 tier.
Profit Multiple by Business Type
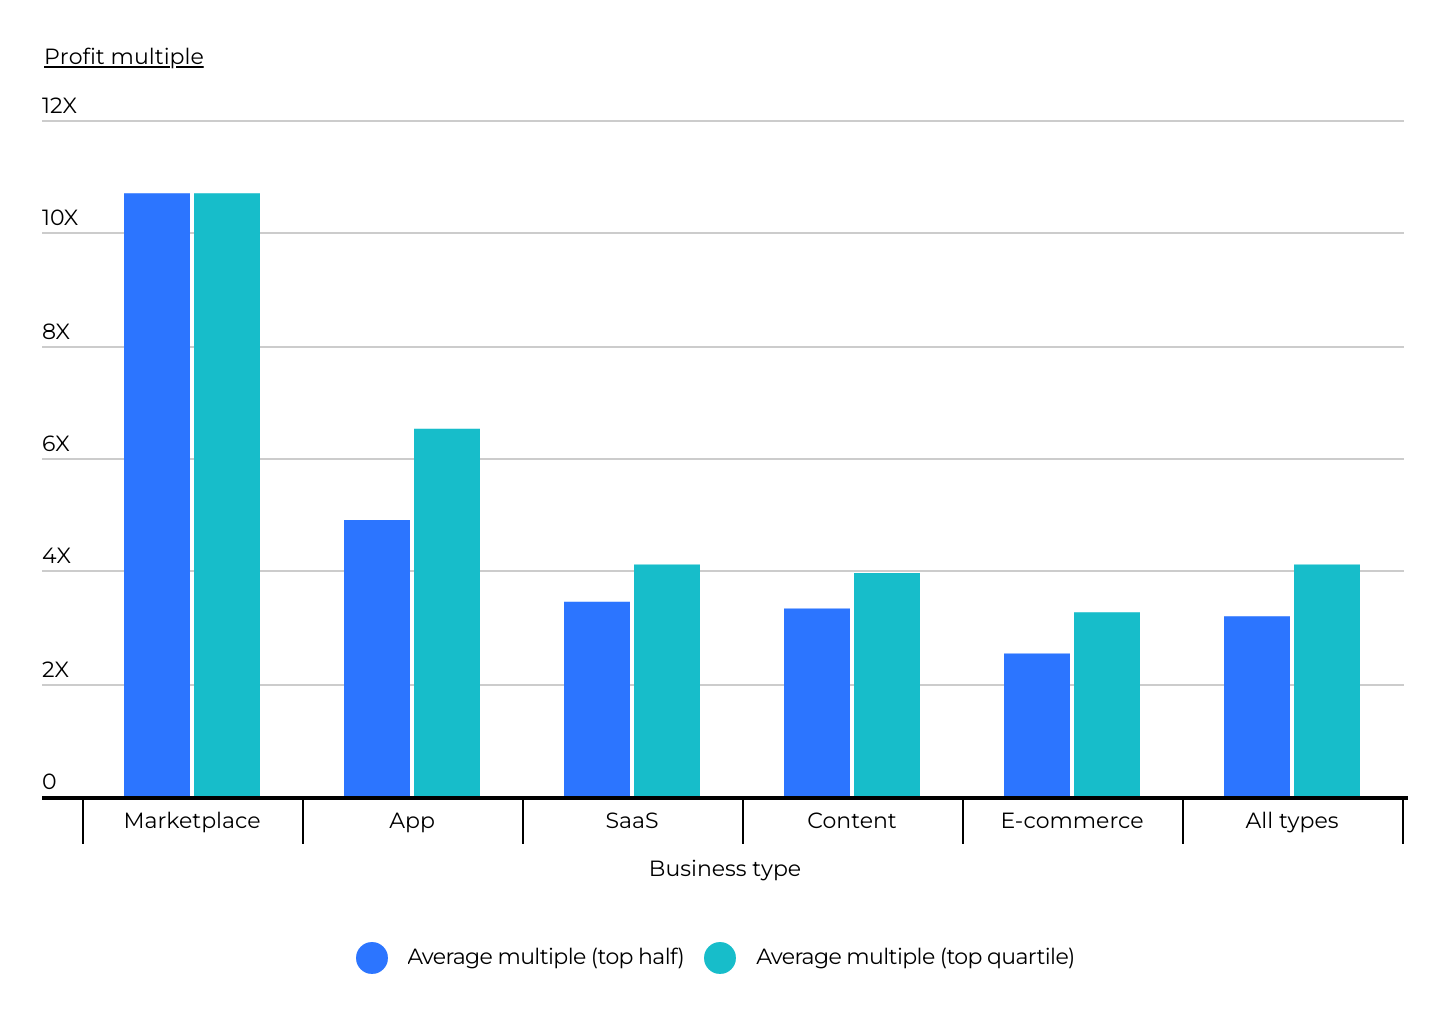
Source: Flippa marketplace transactions
Profit multiples also vary significantly across different business types. Over the past two years, marketplace, apps, and SaaS businesses commanded the highest multiples.
Marketplaces often benefit from network effects, where the value of the platform increases as more users and transactions occur, leading to higher profit multiples. Additionally, the scalability and potential for rapid growth associated with marketplaces and apps can justify higher valuations. Software as a service (SaaS) businesses are also highly attractive assets due to their higher margins and recurring revenue models, but profit multiples range widely based on several factors related to their viability and growth potential. Revenue metrics such as monthly or annual recurring revenue provide insights into revenue stability and growth trajectory, while profitability metrics like gross margin and EBITDA gauge operational efficiency and financial health. Customer metrics, including customer acquisition cost and lifetime value (LTV), help evaluate marketing and retention strategies. Additionally, factors such as market size, competitive advantage, and product roadmap are crucial for understanding growth prospects and market positioning.
At the other end of the spectrum, content and e-commerce businesses saw the lowest multiples, likely due to higher competition and lower barriers to entry when compared to other business types.
Transaction Volume by Business Type
Source: Flippa marketplace transactions
Analyzing the total business acquisition volume from Flippa’s M&A platform across different business types reveals notable variations in market activity. SaaS businesses emerged as the dominant force, comprising the largest share of acquisitions over the past two years. This trend underscores the enduring appeal of SaaS models, driven by their recurring revenue streams and scalability. E-commerce businesses also commanded a significant portion of the acquisition volume, indicative of the continued growth and evolution of online retail platforms in response to shifting consumer behaviors.
Content-based businesses, although representing a substantial share, experienced slightly lower acquisition volumes compared to the SaaS and e-commerce sectors. This trend suggests that while content remains a valuable asset, market dynamics may have favored other business models during the period. Apps, while constituting a smaller share, retained significance due to their potential for user engagement and monetization. Finally, marketplace businesses, while niche, played a notable role in the acquisition landscape, reflecting the enduring appeal of platforms facilitating peer-to-peer transactions.
Industries With the Most Transaction Activity
Source: Flippa marketplace transactions
Among business sales in which the industry was known in 2023, those in the pets, beauty, and fashion industries dominated. Together, these industries constituted approximately one-third of the total transaction volume. What’s noteworthy is not only did each of these industries experience year-over-year growth in total transaction volume, but they also expanded their share of the overall transaction volume. Other industries that experienced notable growth from 2022 to 2023 include football, humor, SEO, and cars. Industries that declined year-over-year include travel guides, shopping, colleges and courses, and cycling.
Methodology

Photo Credit: Ground Picture / Shutterstock
The data used in this study is from a proprietary set of digital asset sales that occurred on the Flippa.com platform between 2022 and 2023. For the purpose of this analysis, only transactions involving mature (at least four years old), profitable businesses with a sale price greater than or equal to $25,000 were included. Additionally, to improve relevance, only the top 50th percentile of transactions based on profit multiples were included in the analysis.
For complete results, see Trends in Online Business Acquisitions [2024 Edition] on Flippa.