


Homeownership stands as a cornerstone of the American dream, providing individuals and families with the opportunity to accumulate wealth and maintain relatively consistent housing costs over time. The financial stability derived from homeownership is regarded as a key avenue for economic advancement and security. However, the realization of these benefits has not been uniform across demographic groups. These disparities, particularly along racial lines, have persisted for decades, resulting in substantial wealth gaps and reduced financial security among various minority groups.
Minority Homeownership Rate Over Time
While the minority homeownership rate is far below that of White Americans, it has increased significantly in recent years
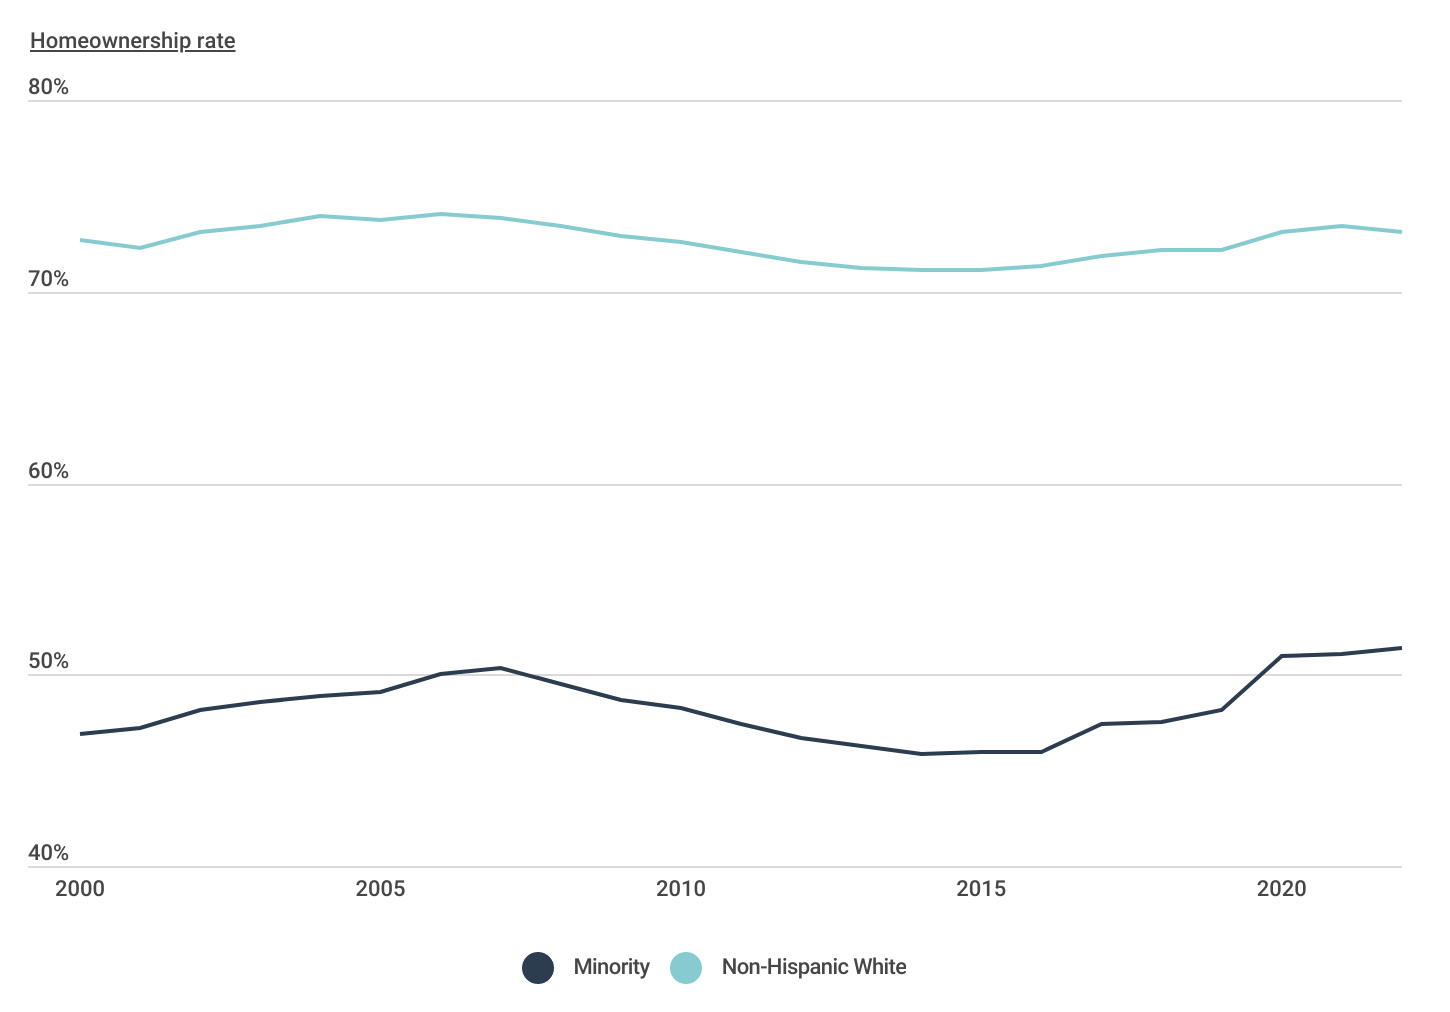
Source: Construction Coverage analysis of U.S. Census Bureau data | Image Credit: Construction Coverage
The minority homeownership gap—defined here as the difference between the White homeownership rate and the minority homeownership rate—has exceeded 20 percentage points for at least the past two decades. While the homeownership gap narrowed slightly during the housing bubble of the early 2000s, it proceeded to widen after the housing market crash in 2008. The repercussions of the subsequent recession disproportionately affected minority communities, leading to higher rates of home loss compared to their White counterparts.
While minorities are often more negatively impacted by economic downturns and slower to recover in the years following, the COVID-19 recession proved different. A combination of a swift overall economic recovery, targeted financial stimulus, and dedicated housing support initiatives resulted in one of the most equitable recoveries in recent history.
Consequently, the minority homeownership rate experienced substantial gains, growing from 48.1% in 2019 to 51.4% in 2022. During the same timeframe, the White homeownership rate increased by just 0.9 percentage points, inching from 72.2% to 73.1%. The result is that the minority homeownership gap has shrunk to 21.7 percentage points, its lowest level in recent years.
Homeownership Rates by Race & Ethnicity
Of the largest racial/ethnic groups, Black Americans have the lowest homeownership rates
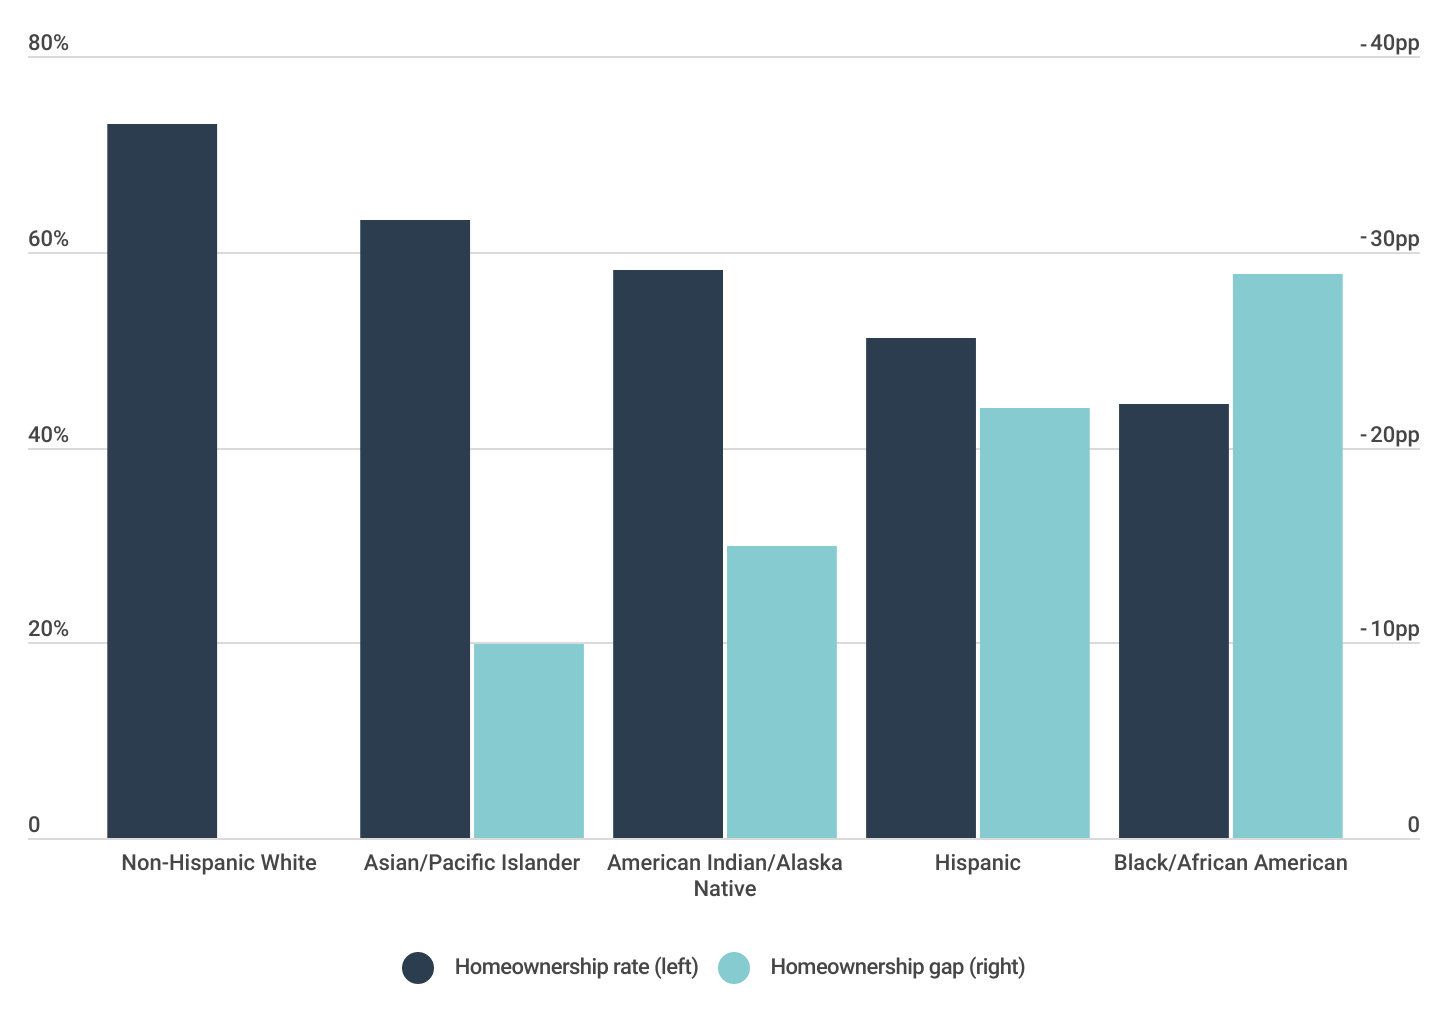
Source: Construction Coverage analysis of U.S. Census Bureau data | Image Credit: Construction Coverage
Despite the overall minority homeownership gap narrowing to below 22 percentage points, the gap varies by race and ethnicity. Among the nation’s largest minority groups, Asians and Pacific Islanders have the highest rates of homeownership at 63.2%, followed by American Indian and Alaskan Natives at 58.2%. Hispanic and Black Americans have the lowest homeownership rates, at just 51.1% and 44.3%, respectively.
Even with recent improvements, the homeownership gap between Black and White Americans is actually wider today than it was in the 1960s when it was legal to refuse to sell a home to someone because of their race. More so than other demographic groups, Black people were hit especially hard by the housing crisis in 2008 because they more frequently bought homes at the height of the bubble and were disproportionately the victims of subprime lending.
Minority Homeownership Gaps by Location
The Midwest and Northeast have the largest minority homeownership gaps
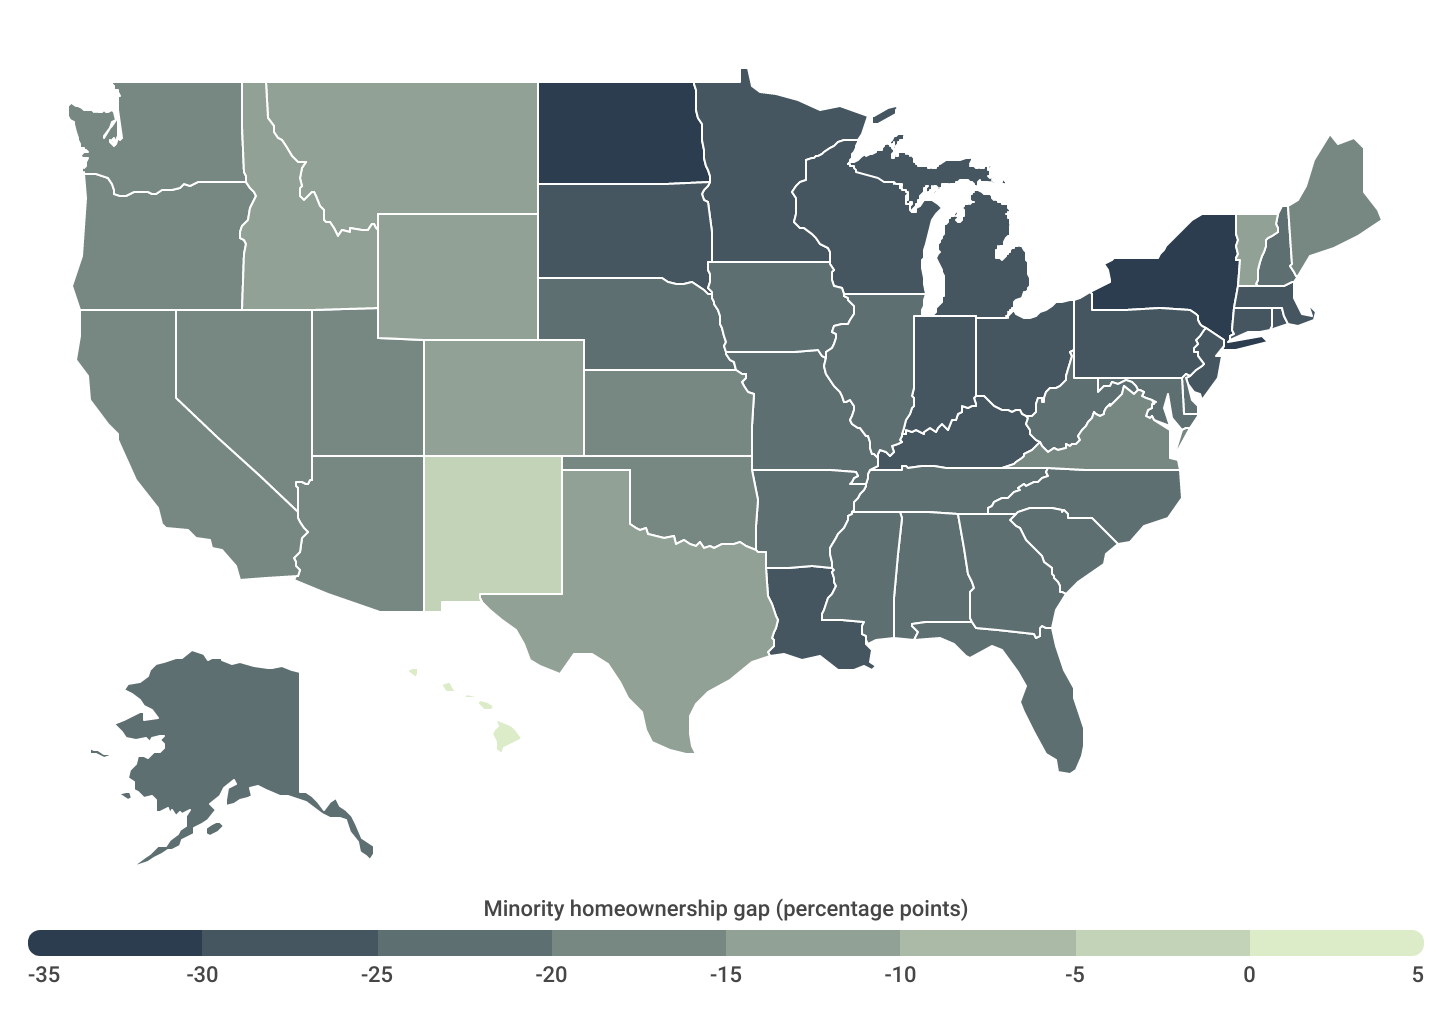
Source: Construction Coverage analysis of U.S. Census Bureau data | Image Credit: Construction Coverage
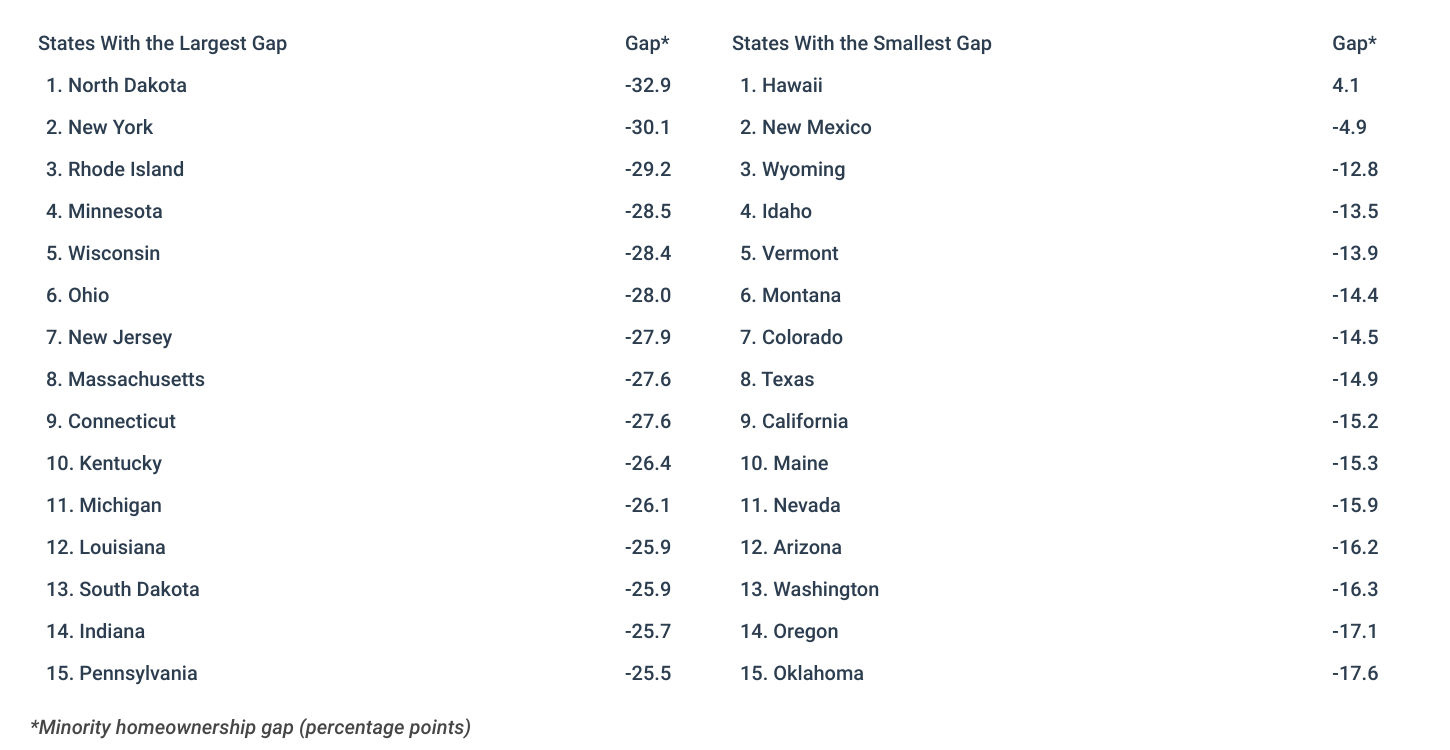
The minority homeownership gap varies across the U.S. due to factors such as local demographic makeup, housing costs, employment opportunities, and historical homeownership rates. On a regional basis, the minority homeownership gap is largest in the Midwest and Northeast. North Dakota and New York report the largest differences between White and non-White homeownership at 32.9 and 30.1 percentage points, respectively. These are the only two states where the gap exceeds 30 percentage points. Other states with large gaps include Rhode Island (29.2pp), Minnesota (28.5pp), and Wisconsin (28.4pp).
Conversely, Hawaii is the only state in which the minority homeownership rate exceeds that of White residents. Nearly 64% of minority households own their homes in Hawaii, compared to less than 60% of White households.
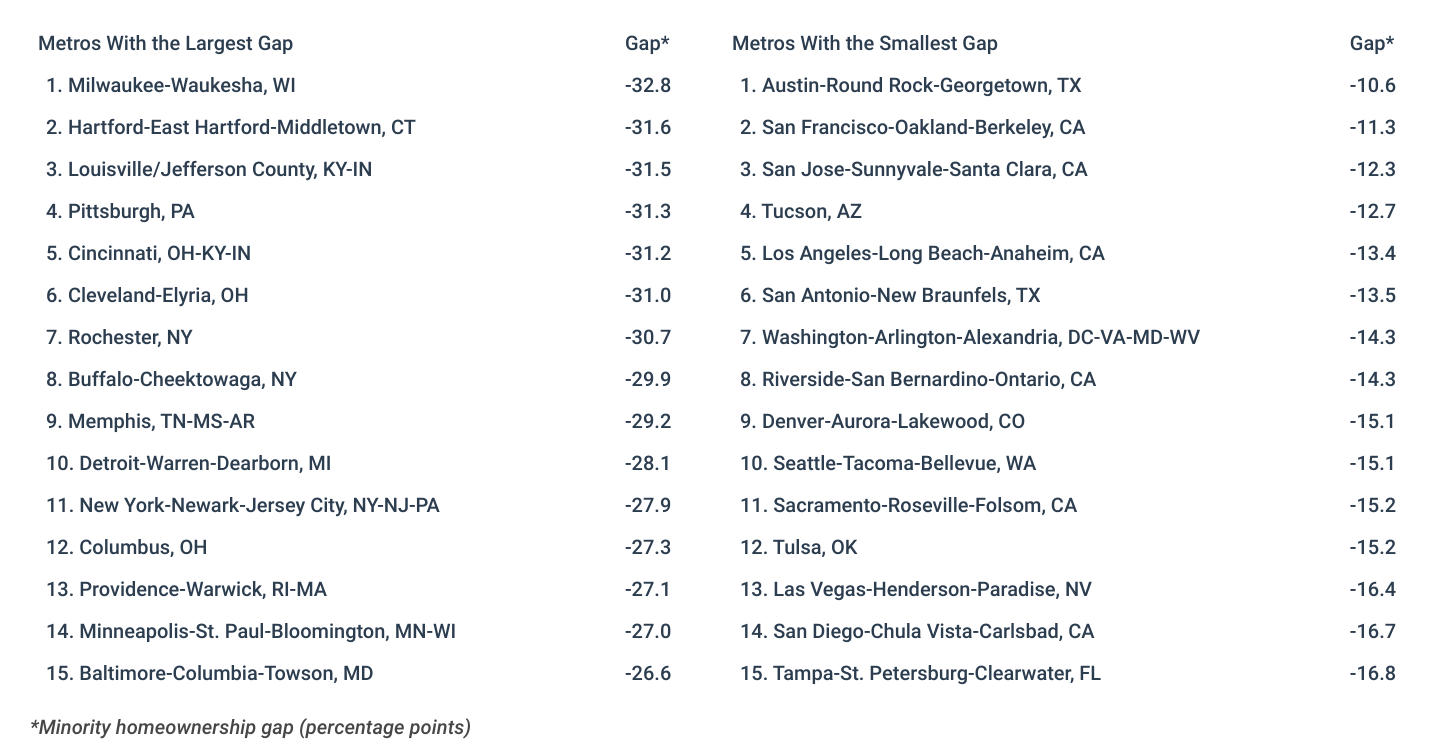
Similar trends hold true at the local level, with metropolitan areas in the Midwest, Northeast, and South reporting the most significant disparities in homeownership rates. Among major metros with more than one million residents, Milwaukee, WI, Hartford, CT, and Louisville, KY have the largest gaps—all exceeding 31 percentage points. At the opposite end of the spectrum, large metros in Texas and California, such as Austin, San Francisco, San Jose, Los Angeles, and San Antonio, stand out for having some of the smallest differences in homeownership between minority and non-minority communities.
Below is a complete breakdown of minority homeownership gaps across more than 250 metropolitan areas and all 50 states. The analysis was conducted by researchers at Construction Coverage, a website that provides construction software and insurance reviews, using data from the U.S. Census Bureau. For the purpose of this analysis, minorities are defined as people who do not identify as non-Hispanic White. For more details on how the research was conducted, refer to the methodology section.
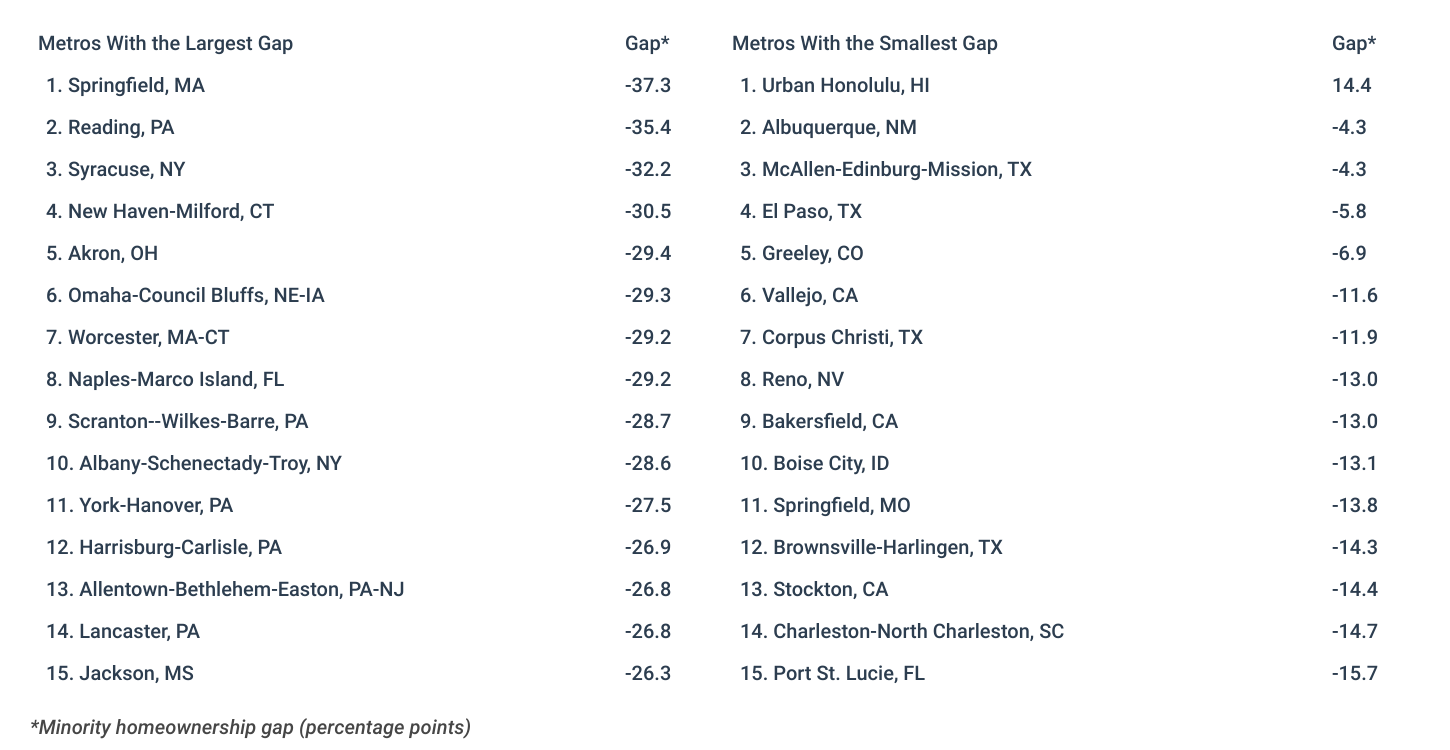
Large Metros With the Largest Minority Homeownership Gap
Midsize Metros With the Largest Minority Homeownership Gap
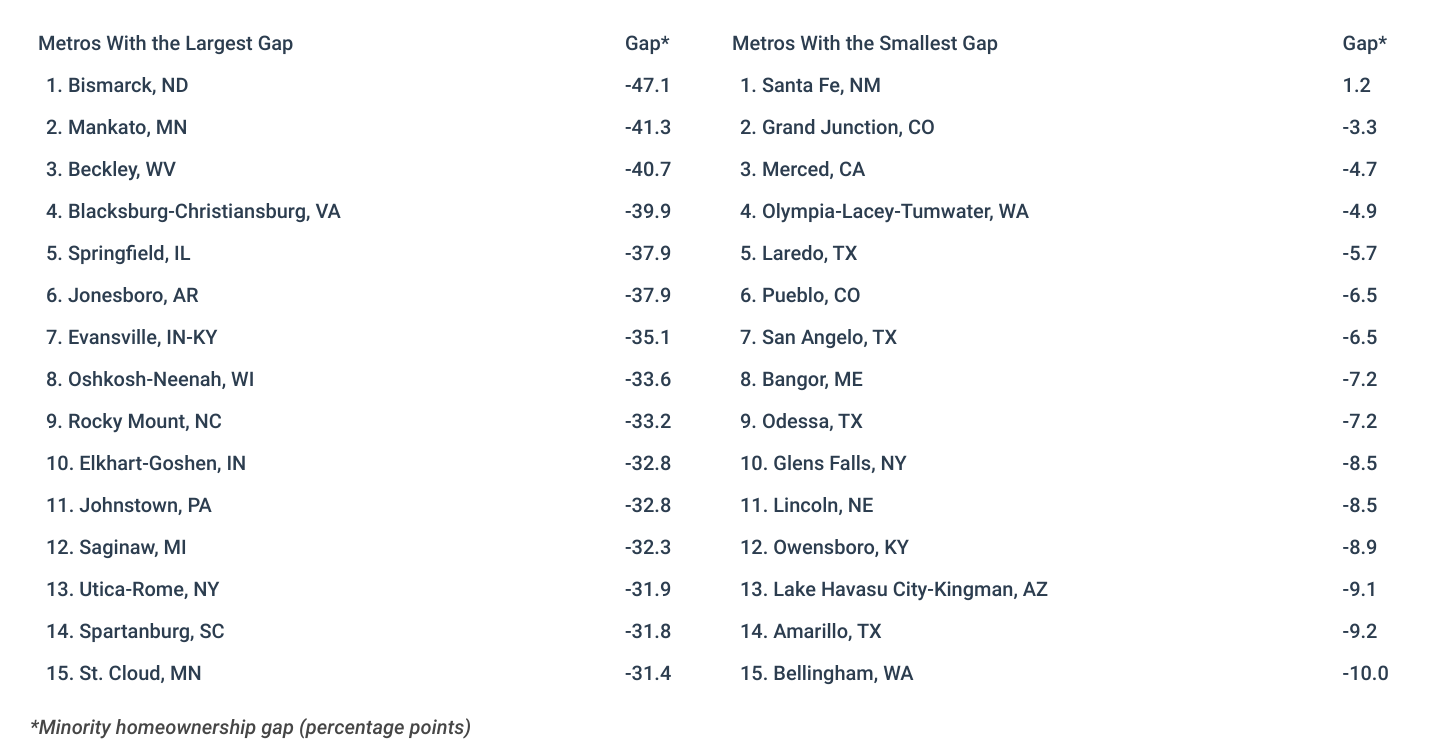
Small Metros With the Largest Minority Homeownership Gap
States With the Largest Minority Homeownership Gap
Methodology

Photo Credit: fizkes / Shutterstock
To determine the locations with the largest minority homeownership gap, researchers at Construction Coverage analyzed the latest data from the U.S. Census Bureau’s 2022 American Community Survey. The researchers ranked metros according to the minority homeownership gap, defined as the percentage point difference in homeownership rates between Whites and minorities. Researchers also calculated the minority median property value and the White median property value. For the purposes of this analysis, minorities are people who are not non-Hispanic White.
To improve relevance, only metropolitan areas with at least 100,000 people were included in the analysis. Additionally, metro areas were grouped into the following cohorts based on population size:
- Small metros: 100,000–349,999
- Midsize metros: 350,000–999,999
- Large metros: more than 1,000,000
For complete results, see American Cities With the Largest Minority Homeownership Gap on Construction Coverage.